Gain valuable insights
With live up to the minute data you can see at a glance that your team is heading in the right direction.
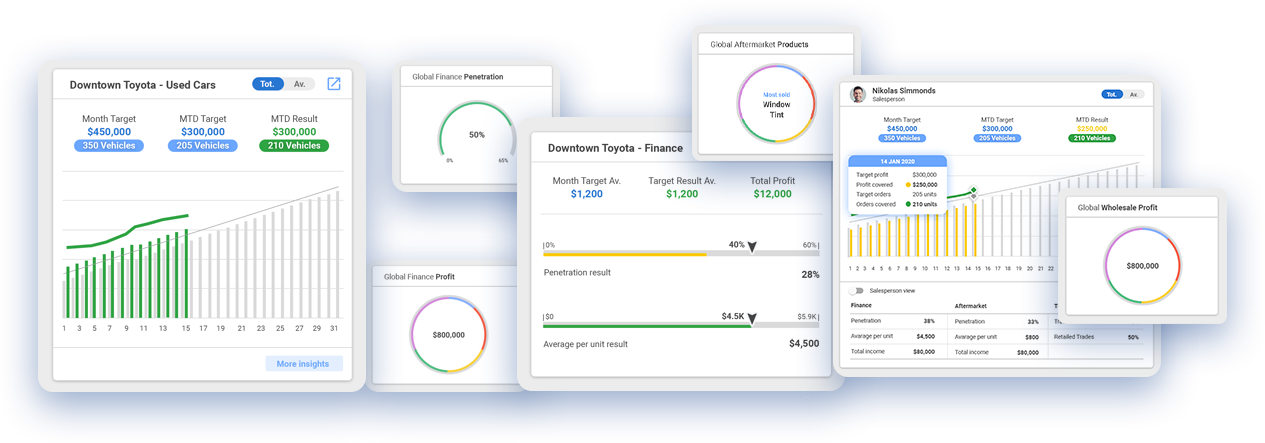
With KPIs at multiple levels you can identify performance on demand.
In just a click, high-level KPIs focus on the overall performance of the business.
Drill down your data into low-level KPIs to focus on performance in departments such as sales, finance, aftermarket and wholesale.
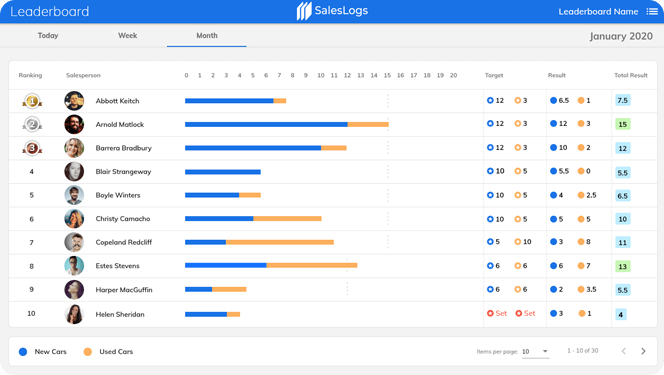
“Measure the performance of each rooftop on demand”
“Make decisions quickly based on real time data"
"Accountability for performance knowing you're on track"
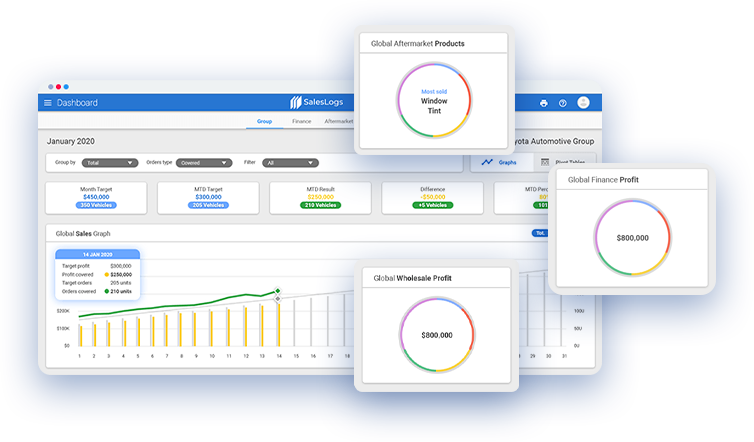
Get a high-level overview at a glance.
See the whole picture in one place regardless of how many rooftops you have.
Act on real-time performance, not guess work.
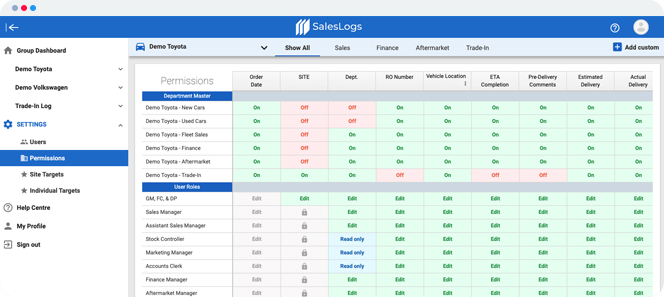
See exactly how your department is tracking in a single view allowing you to make decisions with confidence.
With just a click, present data that matters to you.
You don't have to be a data analyst to get the information you need. There's no Degree in Computer Science needed here.